Troubleshoot a Secure Firewall ASA device
ASA fails to reconnect to Security Cloud Control after reboot
An ASA reconnection failure is a connectivity issue that
-
occurs when an ASA device fails to reconnect to Security Cloud Control after a reboot
-
happens because the ASA has fallen back to using an OpenSSL cipher suite that is not supported by Security Cloud Control's Secure Device Connector (SDC), and
-
requires troubleshooting to test for the cipher suite issue and apply remediation steps.
Symptoms
-
ASA reboots and Security Cloud Control and the ASA fail to reconnect. Security Cloud Control displays the message, "Failed to reconnect."
-
When attempting to onboard an ASA, Security Cloud Control displays the message: Certificate could not be retrieved for <ASA_IP_Address>.
Disable ASA client-side certificate authentication for onboarding
Disable client-side certificate authentication on ASA to enable successful onboarding to Security Cloud Control.
Environment: ASA is configured with client-side certificate authentication.
Solution: Disable client-side certificate authentication.
Details: ASAs support credential-based authentication as well as client-side certificate authentication. Security Cloud Control cannot connect to ASAs that use client-side certificate authentication. Before onboarding your ASA to Security Cloud Control, make sure it does not have client-certificate authentication enabled by using this procedure:
Procedure
|
Step 1 |
Open a terminal window and connect to the ASA using SSH. |
|
Step 2 |
Enter global configuration mode. |
|
Step 3 |
At the hostname (config)# prompt, enter this command: no ssl certificate-authentication interface interface-nameport 443 The interface name is the name of the interface Security Cloud Control connects to. |
Client-side certificate authentication is disabled on the ASA, allowing successful onboarding to Security Cloud Control.
Determine the OpenSSL cipher suite used by your ASA
This task helps you identify whether the OpenSSL cipher suite on your ASA is compatible with the Secure Device Connector (SDC).
Use this procedure to identify the OpenSSL cipher suite being used by your ASA. If the cipher suite named in the command output is not in the list of supported cipher suites, the SDC doesn't support that cipher suite and you will need to update the cipher suites on your ASA.
Procedure
|
Step 1 |
Open a console window on a computer that can reach the SDC. |
||
|
Step 2 |
Connect to your SDC using SSH. You can log in as a regular user such as Security Cloud Control or SDC or some other user you created. You don't need to be logged in as root.
|
||
|
Step 3 |
At the command prompt enter: openssl s_client -showcerts -connect ASA_IP_Address:443 |
||
|
Step 4 |
Look for these lines in the command output. In this example, the cipher suite being used by the ASA is |

The command output displays the OpenSSL cipher suite being used by your ASA, allowing you to verify its compatibility with the SDC.
Cipher suites supported by Security Cloud Control's Secure Device Connector
Security Cloud Control's Secure Device Connector uses node.js which only accepts the latest and most secure ciphers. As a result, Security Cloud Control's SDC only supports this list of ciphers:
-
ECDHE-RSA-AES128-GCM-SHA256
-
ECDHE-ECDSA-AES128-GCM-SHA256
-
ECDHE-RSA-AES256-GCM-SHA384
-
ECDHE-ECDSA-AES256-GCM-SHA384
-
DHE-RSA-AES128-GCM-SHA256
-
ECDHE-RSA-AES128-SHA256
-
DHE-RSA-AES128-SHA256
-
ECDHE-RSA-AES256-SHA384
-
DHE-RSA-AES256-SHA384
-
ECDHE-RSA-AES256-SHA256
-
DHE-RSA-AES256-SHA256
If the cipher suite you use on your ASA is not in this list, SDC does not support it and you will need to Update your ASA's cipher suite.
Update your ASA's cipher suite
Update the TLS cipher suites on your ASA to ensure secure communication by configuring specific encryption protocols that meet your security requirements.
You need to modify the TLS cipher suite configuration when strengthening the security posture of your ASA device or when compliance requirements mandate specific encryption standards.
Procedure
|
Step 1 |
Connect to the ASA using SSH. |
||
|
Step 2 |
Once connected to the ASA, elevate your privileges to global configuration mode. Your prompt should look like this: asaname(config)# |
||
|
Step 3 |
At the prompt, enter a command similar to this: Example:
|
||
|
Step 4 |
After you submit the command, enter write memory at the prompt to save the local configuration. Example: |

The ASA is now configured with the specified TLS cipher suites, and the configuration has been saved to memory.
Troubleshoot ASA using CLI commands
This section discusses some of the important commands you may want to use to troubleshoot the ASA and test basic connectivity. See CLI Book 1: Cisco ASA Series General Operations CLI Configuration Guide to learn about other troubleshooting scenarios and CLI commands. In the 'System Administration' section, navigate to the 'Testing and Troubleshooting' chapter.
You can use the Security Cloud Control CLI interface available for each ASA device to execute these commands.
See ASA command line interface to learn about how to use the CLI interface in Security Cloud Control.
NAT policy settings
Some of the important commands to determine the NAT settings are as follows:
-
To determine NAT policy statistics, use show NAT.
-
To determine the NAT pools, including the addresses and ports allocated, and how many times they were allocated, use show NAT pool.
For more commands related to NAT, see CLI Book 2: Cisco ASA Series Firewall CLI Configuration Guide, and navigate to the 'Network Address Translation (NAT)' chapter.
Test basic connectivity: pinging addresses
You can ping the ASA device using the ping <IP address> command using the ASA CLI interface.
Display the routing table
Use the show route command to view the entries in the routing table.
ciscoasa# show route
Example output for a routing table of an ASA:
Codes: L - local, C - connected, S - static, R - RIP, M - mobile, B - BGP
D - EIGRP, EX - EIGRP external, O - OSPF, IA - OSPF inter area
N1 - OSPF NSSA external type 1, N2 - OSPF NSSA external type 2
E1 - OSPF external type 1, E2 - OSPF external type 2, V - VPN
i - IS-IS, su - IS-IS summary, L1 - IS-IS level-1, L2 - IS-IS level-2
ia - IS-IS inter area, * - candidate default, U - per-user static route
o - ODR, P - periodic downloaded static route, + - replicated route
SI - Static InterVRF

Gateway of last resort is 192.168.0.254 to network 0.0.0.0

S* 0.0.0.0 0.0.0.0 [1/0] via 192.168.0.254, management
C 10.0.0.0 255.0.0.0 is directly connected, Outside
L 10.10.10.1 255.255.255.255 is directly connected, Outside
C 192.168.0.0 255.255.255.0 is directly connected, management
L 192.168.0.118 255.255.255.255 is directly connected, management
Monitor switch ports
-
show interface
Displays interface statistics.
-
show interface IP brief
Displays interface IP addresses and status.
-
show ARP
Shows dynamic, static, and proxy ARP entries. Dynamic ARP entries include the age of the ARP entry in seconds.
Example output of ARP entries:
management 10.10.32.129 0050.568a.977b 0
management 10.10.32.136 0050.568a.5387 21
LANFAIL 20.20.21.1 0050.568a.4d70 96
outsi 10.10.16.6 0050.568a.e6d3 3881
outsi 10.10.16.1 0050.568a.977b 5551
Troubleshoot missing information on the RA VPN monitoring page
This task resolves issues where information is missing on the RA VPN monitoring page by enabling the outside interface for Webvpn on an ASA device.
This issue may occur if the outside interface is not enabled for Webvpn when configuring remote access VPN on an ASA device.
Procedure
|
Step 1 |
In the navigation pane, click Inventory. |
|
Step 2 |
Click the Devices tab and then click the ASA tab. |
|
Step 3 |
In the left pane, click and then click the ASA tab. |
|
Step 4 |
Select the RA VPN headend ASA device that is having issues. |
|
Step 5 |
In the Management pane on the right, click Configuration. |
|
Step 6 |
Click Edit and search for 'webvpn'. |
|
Step 7 |
Press Enter and add enable interface_name. Here, the interface_name is the name of the outside interface to which users connect when making the remote access VPN connection. Although this is normally the outside (internet-facing) interface, choose whichever interface is between the device and the end-users you are supporting with this connection profile. Example:For example: |
|
Step 8 |
Click Save. |
|
Step 9 |
Preview and deploy the configuration to the device. |
The outside interface is now enabled for Webvpn, and information should appear correctly on the RA VPN monitoring page.
ASA real-time logging
ASA real-time logging is a logging feature that
-
displays the last 20 seconds of logged data or the last 10 KB of logged data, whichever limit is reached first
-
temporarily changes the existing logging configuration to request debugging-level data during data retrieval, and
-
returns the logging configuration to its previous state after data collection completes.
Real-time logging operation
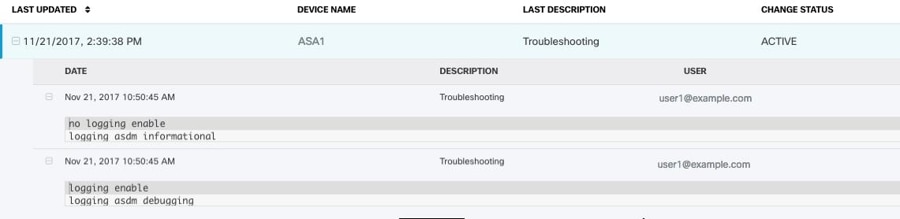
When Security Cloud Control retrieves the real-time data, it reviews the existing logging configuration on your ASDM, changes it to request debugging-level data, and then returns the logging configuration to your configuration. The logging Security Cloud Control displays reflects any logging filters you may have set in ASDM.
You can see the commands that Security Cloud Control sends to perform logging by reviewing the change log. The first entry (on the bottom) indicates that Security Cloud Control "turned on" logging with the logging enable command and changed the ASDM logging level to debugging. The second entry (on the top) shows that the logging configuration was returned to its previous state. Logging was "turned off" with the no logging enable command and the ASDM logging level was returned to informational.
View ASA real-time logs
View real-time logging data from ASA devices to monitor network activity and troubleshoot issues as they occur.
Real-time logs provide immediate visibility into ASA device activity, allowing you to monitor traffic, security events, and system status in real time. You can apply filters to refine the log data and focus on specific events or criteria.
Procedure
|
Step 1 |
On the Inventory page, click the Devices tab. |
|
Step 2 |
In the left pane, click . |
|
Step 3 |
Click the appropriate device type tab and select the device for which you want to view real-time data. |
|
Step 4 |
Click Troubleshoot |
|
Step 5 |
(Optional) Before clicking View Real-time Log, you can define a filter in the left pane to refine the results of your logging search. |
|
Step 6 |
Click View Real-time Log. Security Cloud Control retrieves the real-time logging data based on your filtering criteria and displays it. |
|
Step 7 |
To see an additional 20 seconds of logged data or the last 10 KB of logged data, click View Real-Time Log again. |
 .
Real-time logging data is displayed based on your filtering criteria, allowing you to monitor ASA device activity and troubleshoot issues as they occur.
ASA packet tracer
ASA Packet Tracer is a network troubleshooting tool that
-
sends synthetic packets into the network to evaluate how existing routing configuration, NAT rules, and policy configurations affect that packet
-
works on live, online ASA devices either physical or virtual, and
-
evaluates packets based on the saved configuration on the ASA, not staged changes.
Troubleshooting use cases
Use this tool to troubleshoot these kinds of issues:
-
Users report that they cannot reach resources that they should be able to.
-
Users report that they can reach resources they should not be able to.
-
Test a policy to determine if it works as you expect.
Packet tracer can be used on a live, online, ASA device either physical or virtual. Packet Tracer does not work on ASA model devices. Packet tracer evaluates packets based on the saved configuration on the ASA. Staged changes on Security Cloud Control are not evaluated by packet tracer.
We consider it a best-practice to run packet tracer on an ASA that is in the synced state. Though packet tracer will run if the device is not synced, you could encounter some unexpected results. For example, if you deleted a rule in the staged configuration on Security Cloud Control, and this same rule was triggered on the ASA during packet tracing, Security Cloud Control won't be able to show you the result of the packet's interaction with that rule.
As packet tracer sends the packet through the routing configuration, NAT rules, and security policies of your ASA, it displays
the packet's status at each step. If the packet is allowed by the policy it receives a green checkmark  . If a packet is denied and dropped, Security Cloud Control displays a red X
 .
Packet tracer also displays a real time log of the result of the packet trace. In the example below, you can see where a rule denied a tcp packet.

Troubleshoot an ASA device security policy
Use packet tracer to troubleshoot security policies by simulating packet flow through your ASA device to identify potential connectivity issues and policy violations.
Packet tracer allows you to test how packets traverse through your ASA device's security policies without actually sending real traffic. This helps diagnose connection problems and verify policy configurations.
Procedure
|
Step 1 |
From the Inventory page, select your ASA, and click Troubleshoot |
|
Step 2 |
In the left pane, click . |
|
Step 3 |
Select your ASA and view troubleshooting details in the Troubleshooting pane. |
|
Step 4 |
In the pane, select the interface and packet type you want to send virtually through your ASA. |
|
Step 5 |
(Optional) If you want to trace a packet where the security group tag value is embedded in the Layer 2 CMD header (Trustsec), check SGT number and enter the security group tag number, 0-65535. |
|
Step 6 |
Specify the source and destination. You can specify IPv4 or IPv6 addresses, fully-qualified domain names (FQDN), or security group names or tags if you use Cisco Trustsec. For the source address, you can also specify a username in the format Domain\username. |
|
Step 7 |
Specify other protocol characteristics:
|
|
Step 8 |
Click Run Packet Tracer. |
|
Step 9 |
Continue with Analyze packet tracer results. |
The packet tracer results display the path the simulated packet takes through your ASA device, showing which security policies are applied and whether the packet is allowed or denied.
Troubleshoot an access rule
Use packet tracer troubleshooting to analyze how traffic flows through your network policy and identify issues with specific access rules.
When you need to verify that an access rule is working correctly or diagnose traffic flow issues, the packet tracer tool allows you to simulate network traffic and see how it interacts with your configured rules.
Procedure
|
Step 1 |
Select . |
|
Step 2 |
In the left pane, click . |
|
Step 3 |
Select a policy that is associated with your ASA. |
|
Step 4 |
Select a rule in the network policy to troubleshoot and click Troubleshoot
In the values panel of the troubleshoot page, many of the fields are pre-populated with the attributes of the rule you chose. |
|
Step 5 |
Enter information in the remaining required fields. Once you have completed all the required fields the Run Packet Tracer button becomes active. |
|
Step 6 |
Click Run Packet Tracer. |
|
Step 7 |
Continue with Analyze packet tracer results. |
The packet tracer runs and provides analysis results for the selected access rule, showing how traffic flows through your network policy.
Troubleshoot a NAT rule
This task enables you to diagnose and resolve issues with NAT rules by using packet tracer functionality to analyze traffic flow and rule behavior.
Use this procedure when you need to troubleshoot NAT rule configuration issues on ASA devices. The troubleshooting process helps identify why traffic is not being translated as expected.
Procedure
|
Step 1 |
From the Inventory page, select your ASA, and click View NAT Rules
|
|
Step 2 |
In the left pane, click and then click the ASA tab. |
|
Step 3 |
Select your ASA, and click View NAT Rules
|
|
Step 4 |
Select the rule from the NAT Rules table that you want to troubleshoot and click Troubleshoot
|
|
Step 5 |
Enter information in the remaining required fields. Once you have completed all the required fields the Run Packet Tracer becomes active. |
|
Step 6 |
Click Run Packet Tracer. |
|
Step 7 |
Continue with Analyze packet tracer results. |
 in the Action pane.
The packet tracer runs and provides analysis results that help identify NAT rule issues and traffic flow problems.
Troubleshoot a twice NAT rule
Troubleshoot a Twice NAT rule to identify and resolve issues with packet translation by running packet tracer analysis on source or destination packet flows.
Use this procedure when you need to analyze NAT rule behavior and identify potential issues with packet translation in your ASA configuration. For bi-directional Twice NAT rules, you can troubleshoot either source packet translation or destination packet translation.
Procedure
|
Step 1 |
From the Inventory page, select your ASA, and click View NAT Rules
|
|
Step 2 |
In left pane, click . |
|
Step 3 |
Click the ASA tab, select your ASA, and click View NAT Rules
|
|
Step 4 |
Select the rule from the NAT Rules table that you want to troubleshoot and click Troubleshoot
|
|
Step 5 |
Enter information in the remaining required fields. Once you have completed all the required fields the Run Packet Tracer becomes active. |
|
Step 6 |
Click Run Packet Tracer. |
The packet tracer analysis runs and displays the results, showing how the NAT rule processes the specified packet flow and identifying any issues with the translation.
Analyze packet tracer results
This task helps you understand the reasons behind packet tracer results, whether packets are dropped or allowed, and enables you to make necessary configuration changes to achieve desired access results.
Packet tracer provides detailed information about packet processing decisions. When you run packet tracer, you receive results that show whether packets are allowed or denied, along with the specific rules and policies that influenced these decisions.
Procedure
|
Step 1 |
Expand a row in the packet trace table to view detailed rule or logging information. Whether the packet is dropped or allowed, you can learn why by expanding a row in the packet trace table and reading the rule or logging information related to that action. The expanded view shows the specific access list policy and rules that affected the packet, such as a rule to deny an IP packet coming from any source and going to any destination. |
|
Step 2 |
If the action is not what you want, click the View in Network Policies link to edit the rule. This link allows you to immediately access and modify the relevant network policy rule. |
|
Step 3 |
Deploy the configuration change to the ASA after editing the rule. |
|
Step 4 |
Re-run packet tracer to verify that you get the expected access results. |
|
Step 5 |
Review the ASA real-time logging from the ASA. Along with the packet tracer results, Security Cloud Control displays the real-time logging from the ASA. 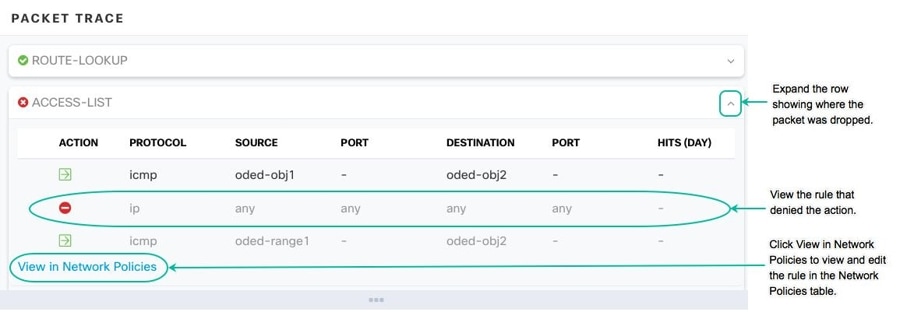
|
You have successfully analyzed the packet tracer results and understand the reasons for packet processing decisions. Any necessary rule modifications have been deployed and verified through re-running packet tracer.
Confirming ASA running configuration size
Confirm the size of your running configuration file to ensure it meets system requirements or limitations.
Use this procedure to determine if your ASA running configuration exceeds the 4.5 MB size limit by copying it to flash storage and examining the file properties.
Before you begin
Follow these steps to confirm the size of your running configuration file:
Procedure
|
Step 1 |
Access the ASA's command line interface in one of these ways:
|
|
Step 2 |
At the prompt type |
|
Step 3 |
When prompted for the Source filename, don't type anything and press <Enter> |
|
Step 4 |
When prompted for the destination filename, enter a name for the output file. After ASA copies the running configuration the file you specified, it returns you to the privileged EXEC prompt. |
|
Step 5 |
At the prompt, type |
|
Step 6 |
Look in the length column. If your file is over 4718592 bytes, it is larger than 4.5 MB. Here is a sample set of commands and output: |
You have successfully determined the size of your ASA running configuration file. Files over 4718592 bytes exceed the 4.5 MB limit.
Limitation: large ASA running configuration files
Configuration file size limitations
Be aware that Security Cloud Control cannot predictably manage ASA devices with running configuration files that are 4.5 MB or larger, contain approximately 22,000 lines or more, or have too many access-list entries for a single access group.
This limitation affects ASA onboarding and ongoing management in Security Cloud Control. You may see behavior such as the ASA failing to onboard, Security Cloud Control not displaying all of the configuration defined in the ASA's running configuration file, or Security Cloud Control failing to write to the change log.
When you onboard an ASA to Security Cloud Control, Security Cloud Control stores a copy of the ASA's running configuration file in its database. Large configuration files exceed database storage and processing capabilities.
To confirm the size of your running configuration file, see Confirming ASA running configuration size. Contact your Cisco account team for help safely reducing the size of your configuration file without disrupting your security policies.
 .

 Feedback
